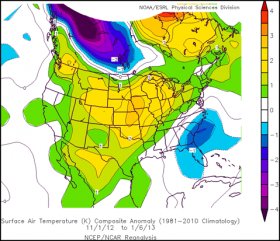
 It's about that time of the year again when the Great Lakes begin to develop significant ice cover. Of course, the buildup of ice has a lot to do with the air temperature and this year the average air temperature around the lakes has been warmer than normal. Figure 1a shows the surface air temperature anomaly for the period November 1st, 2012 through January 5, 2013. As you can see, the air temperature over the Great Lakes ran anywhere from 1 to 2 degrees Centigrade above normal. As a result, the water temperature for the Great Lakes was also running above normal. Figure 1b shows the water temperature on January 8, 2013. Based on data from the Great Lakes Environmental Research Laboratory (GLERL) the average temperatures on each of the Great Lakes are running around 2 to 3 degrees above normal.
Figure 1a
Figure 1b
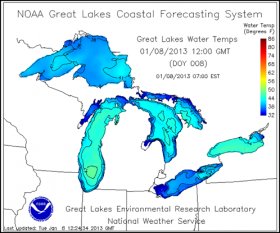 Figure 1a shows the NCEP NCAR Reanalysis of surface air temperature from November 1, 2012 through January 6, 2013. Notice the warmer than average anomalies over the Great Lakes. Figure 1b shows the GLERL water temperatures for the Great Lakes on January 8, 2013. Based on GLERL data these temperatures were running somewhere in the range of 2 to 3 degrees above normal.
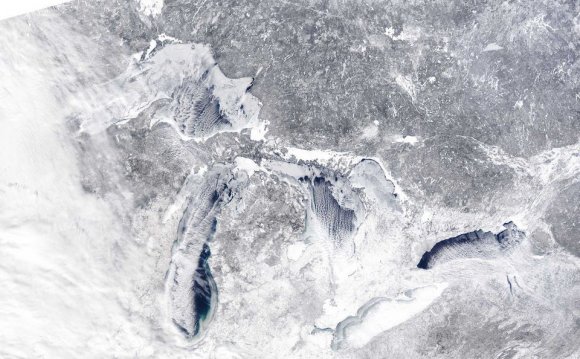
As a result of the warmer conditions, there is currently very little in the way of ice cover on the Great Lakes. Figure 2a shows the ice cover on January 8, 2013. By comparison, Figure 2b shows the 30-year average for ice cover on the Great Lakes during the week of January 8-14. Now granted, we are not that far away from the average ice cover since this is the time of the year that we normally just begin to develop ice. But upon close inspection you will see that we are just a bit behind on the ice cover, especially if you look in some of the bays, such as Green Bay, WI.
Figure 2a
Figure 2b
Figure 2a shows the ice cover across the Great Lakes on January 8, 2013. Figure 2b shows the 30 year average of median ice cover for the week of January 8-14. As you can see there is not too much difference, except in the bays, which typically ice over first. Notice Green Bay on Lake Michigan as an example.
To get an idea of how the ice develops on the Great Lakes from the fall through winter and likewise, how the ice eventually disappears in the spring, I have put together this animation of the average weekly median ice concentration from November through May (Figure 3). You can see just how quickly Lake Erie ices over compared to the other Great Lakes, mainly because Lake Erie has much less volume of water compared to the other Great Lakes.
Figure 3: An animation of the weekly median ice cover from November through May based on the 30 year average from 1973-2002.
YOU MIGHT ALSO LIKE

Share this Post
latest post
-
 Turnip Rock Lake Huron June 30, 2023
 -
 Lake Erie Captains January 30, 2023
 -
 Lake Superior Minnesota December 31, 2022
 -
 Lake Ontario Sturgeon December 1, 2022
 -
 National Park on Lake Erie November 1, 2022
 -
 Lake Erie frozen Foods October 28, 2022
 -
 Lake Erie Dental Erie PA October 27, 2022
 -
 Eagle Lake Ontario fishing Reports October 26, 2022
 -
 Lake Ontario beaches October 21, 2022